
From Data to Decisions — And Back Again

Analytics is often described as turning data into insights.
That is true, but incomplete.
Analytics does not start with data, and it should not end with a decision. It starts with a problem, uses evidence to understand it, informs a decision, and then returns to the data to see whether the decision actually worked.
That makes Analytics a cycle of organisational learning.
Problem → Data → Insights → Decisions → Outcomes → Learning → Data
Analytics does not start with data
Once an organisation decides to take an evidence-led approach, the first task is not to open Excel, Python or a dashboard.
It is to ask whether the problem and its possible causes can be represented meaningfully with data.
Suppose we believe richer countries tend to have longer-living populations. We might use:
GDP per capita as a proxy for wealth; and
life expectancy as a proxy for longevity.
That gives us something measurable. But it also introduces judgement.
A proxy is not the same thing as the concept it represents. So before analysing anything, we need to ask:
Does this measure represent the idea well enough for the decision we are trying to make?
Sometimes the answer may be no. Some issues are difficult to quantify, some require imperfect proxies, and some ultimately depend more on judgement than data.
That is not a failure of Analytics. It is recognising its limits.

DATA: Is the evidence fit for purpose?
Once the measures are clear, the next challenge is finding data we can trust.
In practice, data may be outdated, incomplete, collected for the wrong population, based on changing definitions, or simply unavailable. Even credible sources need context: how was the data collected, whom does it represent, and what are its limitations?
The data may also need substantial cleaning and transformation before it can be analysed.
So the real question is not:
“Do we have data?”
It is:
“Do we have the right data, from a sufficiently reliable source, for this question?”
INSIGHTS: What does the evidence actually support?
Once the data is fit for purpose, mathematics and statistics help us examine our hypotheses.
If we believe richer countries tend to have higher life expectancy, then countries with higher GDP per capita should generally also show higher life expectancy.
A chart may reveal the pattern. Correlation may quantify it. Regression may help examine it more closely.
But the core reasoning is simpler:
If our explanation is right, what should we expect to see in the evidence?
The harder part comes afterwards.

Even if richer countries tend to live longer, that does not automatically mean economic growth itself is the cause. Healthcare, sanitation, education, nutrition or other factors may explain part of the relationship.
So a statistical result is not yet an insight.
Analysis finds patterns. Interpretation gives those patterns meaning.
Critical Problem Solving remains important here. We still need to ask what else could explain the result, whether our proxies are appropriate, and whether we are seeing what we expected because we went looking for it.
DECISIONS: What should we do?
Eventually, the organisation has to move from:
“Here is what the data shows”
to:
“Here is what we think it means, how confident we are, and what we recommend doing.”
This is where evidence reconnects with judgement.
The analysis may favour one option, but leaders still need to consider context, resources, risks, priorities and trade-offs.
And this is where Data Storytelling matters.
Decision-makers rarely need every chart or statistical test. They need a concise, coherent and compelling explanation of:
what we learned;
why we believe it;
what it means;
and what should happen next.
The purpose of Analytics is not to produce more analysis.
It is to support better decisions.
Then we go back to the data
This is the part of the Analytics process that is often overlooked.
A decision is not the end of the cycle.
When we recommend an action, we are effectively saying:
“We believe this action will produce this outcome.”
That is another hypothesis.
So after acting, we should return to the evidence and ask:
Did it?
If an organisation raises pay because it believes compensation is contributing to turnover, it should later examine whether turnover actually improved among the employees it intended to retain.
If the expected outcome does not appear, the cycle starts again.
Perhaps the original hypothesis was wrong. Perhaps the data was incomplete. Perhaps the proxy was poor. Perhaps the interpretation was flawed. Or perhaps the intervention simply did not work.
The point is to learn.
Analytics as an organisational learning cycle
This may be one of the most overlooked advantages of Analytics.
It does not just help an organisation make one decision better. It gives the organisation a more objective way to learn from its past decisions.
Instead of relying only on memory or narrative —
“I think that initiative worked.”
—we can ask:
“What actually happened after we made the decision?”
Over time, organisations can accumulate evidence not just about customers, employees or operations, but about the quality of their own judgement.
That feedback loop helps them make the next decision better.
The cycle can therefore be summarised simply:
DATA - Can we represent the problem meaningfully, and do we have reliable evidence?
INSIGHTS - What does the evidence support, and what does it mean in context?
DECISIONS - What should we do, and what outcome do we expect?
OUTCOMES & LEARNING - What actually happened, and what should we retain, rethink or change?
Then we return to Data.
Data → Insights → Decisions → Outcomes → Learning → Data
Critical Problem Solving sits across the whole cycle — challenging the problem, the measures, the interpretation and ultimately whether reality matched what we expected.
Why this matters even more with AI
AI is making many of the mechanics of Analytics easier. It can help clean data, generate formulas, create charts, run analyses and suggest interpretations.
That is useful.
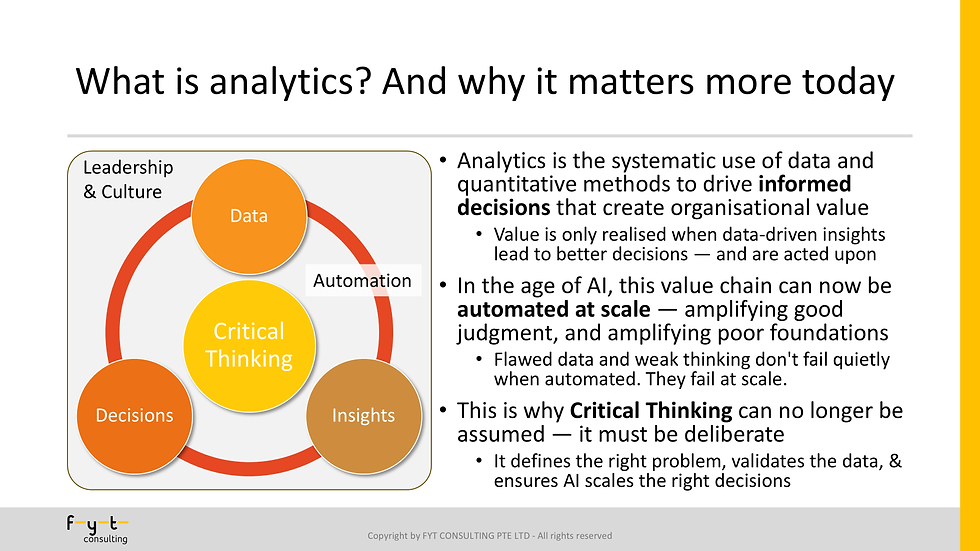
But easier analysis does not remove the need to think carefully about:
what we measure;
what data we trust;
what the results actually mean;
what action makes sense;
and whether the decision worked.
A sophisticated analysis of the wrong problem is still the wrong analysis.
And a decision that is never checked against its outcomes teaches the organisation very little.
Data provides the evidence.
Insights give it meaning.
Decisions turn it into action.
Outcomes tell us what happened.
Learning makes the next decision better.
That is the Analytics cycle.
What do you think?
Where does this cycle most often break down in organisations?
Is it getting the right data, turning evidence into genuine insight, getting insights into decisions — or the often-overlooked step of going back to see whether the decision actually worked?


Comments