
Singapore Ranks 36th in Happiness. But Is That Really the Number We Should Be Looking At?

A recent interview with former Foreign Minister George Yeo got me thinking about happiness, although perhaps not quite in the way the interviewer intended.
During The Mishal Husain Show Live from Singapore, host Mishal Husain raised the apparent contrast between Singapore's economic success and its less impressive showing on happiness rankings. In response, Yeo recalled Lee Kuan Yew's view that governments could provide economic development, infrastructure and education, but should “never promise happiness.” He also reflected on his own experience in government, where poor work-life-balance scores could coexist with high morale and a strong sense of achievement.
Derrick Yuen subsequently picked up on that discussion in a post asking, “Should government make us happy?” His question was about where society's responsibility for our wellbeing ends and personal responsibility begins.
It is an interesting question, and one that can take us in many directions. But being a data person, I found myself wondering about something that comes before the philosophical discussion. Before we decide what Singapore's happiness ranking says about us, are we sure we understand what that number is actually telling us?
Looking underneath the ranking
The 2026 World Happiness Report places Singapore 36th, with a life-evaluation score of 6.585. The score comes from the Gallup World Poll, where people are asked to evaluate their lives on a scale from 0, representing the worst possible life for them, to 10, representing the best possible life. Country rankings are based on three-year averages, so the 2026 results reflect survey responses collected from 2023 to 2025.
On its own, 36th does not tell us very much. It becomes more interesting when we compare it with previous reports.
Report | Life-evaluation score | World rank |
2023 | 6.587 | 25 |
2024 | 6.523 | 30 |
2025 | 6.565 | 34 |
2026 | 6.585 | 36 |
Singapore moved from 25th in 2023 to 36th in 2026. If the ranking were all we looked at, it would be quite natural to conclude that Singaporeans had become less happy over those three reports.
The scores tell a rather different story. Singapore's life-evaluation score was 6.587 in the 2023 report and 6.585 in the 2026 report. In other words, the ranking moved eleven places while the underlying score was almost unchanged.
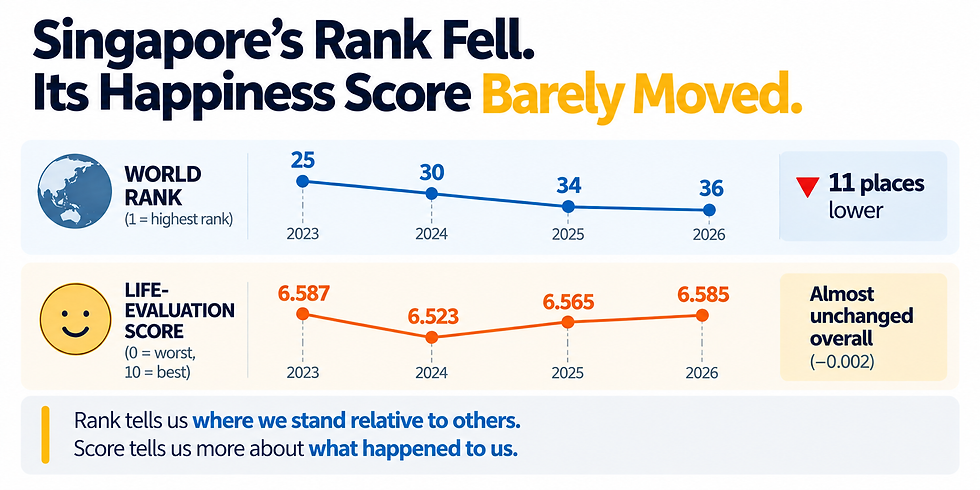
There is an important qualification here. These figures are rolling three-year averages rather than measurements taken at two single points in time, so the 0.002 difference should not be interpreted as a precise measure of how much happiness changed between 2023 and 2026. There is statistical uncertainty around the ranking too. In the 2026 report, Singapore's rank has a 95% confidence interval stretching from 25th to 45th.
None of this makes the ranking meaningless. It simply reminds us that a ranking and the measure behind it answer different questions. The score tells us more about how Singapore's own reported life evaluation has changed, while the ranking tells us where Singapore stands relative to other countries. Our rank can therefore fall even when our own score changes very little, simply because the countries around us have also moved.
This is a distinction we sometimes forget when looking at league tables, benchmarks and rankings. A change in position feels like a change in performance, but the two are not necessarily the same thing.
And when I looked a little further into the 2026 data, the national ranking became even less interesting than what was sitting underneath it.
The national number is only part of the story
Singapore's overall position is 36th, but the World Happiness Report also provides results by age. For Singapore, the picture looks quite different once the population is broken down:
All ages: 36th The Rest: 29th The Young: 69th
The report defines “The Young” as people under 25, with “The Rest” covering the remaining population.
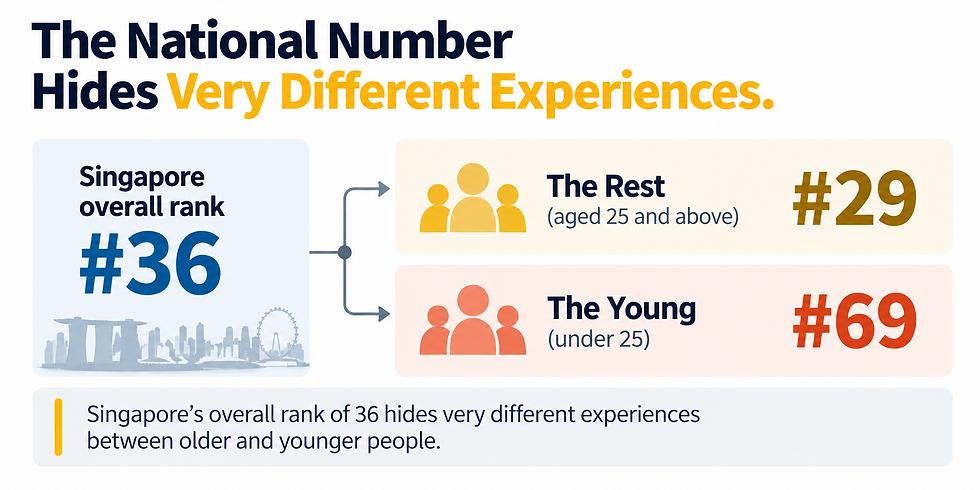
For me, this is where the analysis becomes much more interesting. The national figure gives us a useful overall picture, but the age breakdown suggests that younger respondents are reporting something quite different from the rest of the population.
This is not unique to happiness data. We encounter the same issue regularly in business. A company's overall customer-satisfaction score can remain healthy while one important customer segment is becoming increasingly dissatisfied. Employee engagement can look stable across an organisation while the experience in one business unit or age group is moving in another direction. Sales can appear respectable overall while one strategically important product category is deteriorating.
The aggregate gives us the big picture; segmentation can show us where we should look more closely.
But that brings us to another analytical trap. Seeing that Singapore's young rank 69th naturally makes us want to explain why. We might immediately think about cost of living, housing, employment prospects, social media, stress or expectations about the future. Any of these could become a reasonable line of investigation. Several may interact, and other factors that have not occurred to us may prove more important.
The crucial point is that the ranking itself cannot tell us which explanation is correct.
What the age breakdown has done is show us where there may be something worth investigating. It has not diagnosed the cause. This is where analysis can easily go wrong: we see an interesting pattern, think of a plausible explanation and gradually start treating that explanation as though it came from the data.
In analytical terms, those possible explanations are hypotheses, not findings. If we genuinely wanted to understand why younger Singaporeans report different life evaluations, we would need more evidence. We might examine how the pattern has changed over time, compare different age groups in greater detail, look at other measures of wellbeing and test possible explanatory factors. Quantitative data may not be enough either; qualitative research could help us understand experiences that a national survey score cannot capture.
Some of our initial explanations might survive that analysis. Others may disappear altogether. That is precisely why Hypothesis comes before Prepare and Analyse/Test in our FYT Analytics Thought Process. We identify possible explanations or propositions and then ask what evidence we need to test them, rather than using the data simply to confirm the explanation that first came to mind.
From an interesting number to a useful decision
There is still one more step. Suppose our objective really were to improve wellbeing in Singapore. Knowing that the country ranks 36th would not tell us what to do, and discovering that the young rank 69th would not tell us what to do either.
What the second finding gives us is a more focused place to investigate. To move towards action, we would still need to understand what lies behind the difference, which factors are important, which are actionable and what interventions, if any, might reasonably improve the outcome.
That analytical journey might therefore look something like this:
Headline → Measure → Segment → Hypotheses → Evidence → Decision
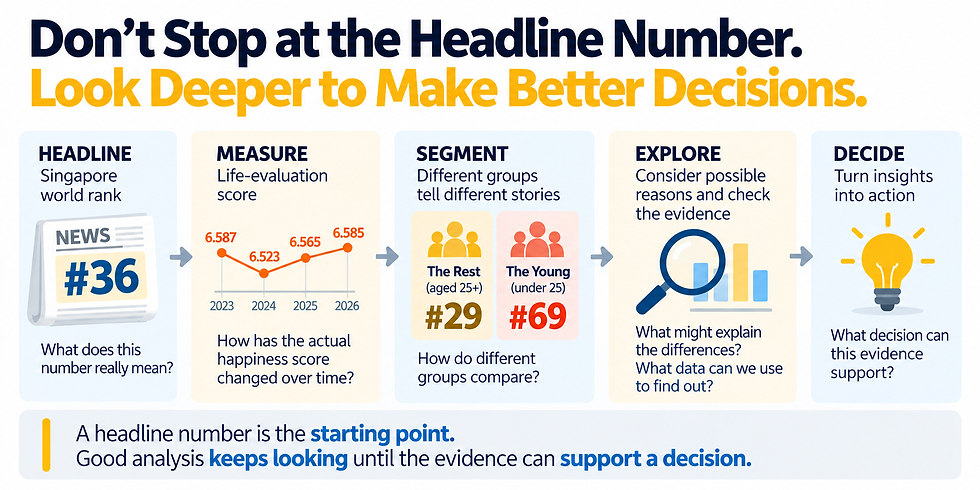
This is also where the happiness example becomes relevant well beyond a discussion about Singapore.
Imagine that your company's customer-satisfaction ranking falls from fifth in the industry to twelfth. It would be easy to walk into the next management meeting saying that customer satisfaction has deteriorated. But suppose your actual satisfaction score has barely changed and several competitors have simply improved. Now suppose you segment your own customers and discover that satisfaction is stable almost everywhere except among one strategically important group, where it has fallen noticeably.
We would now be having a very different conversation. Instead of asking why our ranking fell, we would be asking what actually changed, for whom, why it may have changed, and what evidence we need before deciding what to do about it.
The same thinking applies to employee engagement, service levels, sales performance, operational KPIs and many of the other numbers that appear on our dashboards. Headline numbers are useful because they draw our attention to something, but they are often the beginning of analysis rather than its conclusion.
George Yeo's interview started with a broad and interesting question about Singapore, achievement and happiness. Derrick's post took that discussion towards the respective roles of society and the individual. Looking more closely at the data took me in another direction again.
I don't think the happiness ranking by itself can tell us whether Singapore has a happiness problem, much less explain what might be causing one. What it can do is prompt us to look underneath the headline and ask better questions.
Perhaps that is the more transferable lesson. When a KPI rises, a ranking falls, an average remains stable or a target is missed, our instinct is often to ask immediately what it means. Before doing that, it may be worth asking something simpler: what exactly moved? Did the underlying measure change? Did only our position relative to others change? Was the movement widespread, or was something quite different happening within a particular segment?
Finding the number is often the easy part. Knowing which number deserves our attention is where analysis begins.
Mini-Appendix: A Few Useful Terms
Life evaluation
A person's assessment of the overall quality of their life. In the World Happiness Report, respondents evaluate their lives using the Cantril Ladder which runs from 0 to 10.
Ranking
A position relative to others. Your ranking can change because your own result changes, because other results change, or both.
Aggregate
A result that combines observations across a population or group. It provides an overall picture but can conceal meaningful differences within that population.
Segmentation
Breaking an overall result into meaningful groups, such as age, customer type, location or business unit, to investigate whether different groups show different patterns.
Confidence interval
A range that reflects statistical uncertainty around an estimate. For a ranking, it is a reminder that the reported position should not necessarily be treated as an exact position.
Sources
World Happiness Report 2026, Wellbeing Research Centre, University of Oxford. World Happiness Report data and statistical appendices: https://www.worldhappiness.report/data-sharing/
World Happiness Report 2026 — Statistical Appendix https://files.worldhappiness.report/WHR26_Statistical_Appendix.pdf


Comments