
Regardless of Race, Language, or Religion: What Do We Actually Know About Each Other?
- 6 days ago
- 11 min read
Updated: 5 days ago

On 9 August, flags will go up along the corridors, the Home Team will march past, and most of us will have another NDP song stuck in our heads by lunchtime. This year's parade carries the theme "Majulah Singapura, Go Beyond," marking Singapore's 61st year — a reminder that moving forward together has always rested on a line from the Pledge most of us could recite half-asleep: "regardless of race, language or religion." We say it every year. But how well do we actually know the neighbour whose race, language, or religion isn't the same as ours?
We recently spent time in the Singapore Department of Statistics' General Household Survey 2025 — specifically the detailed population and religion tables — at a level of granularity rarely discussed outside government reports. What we found wasn't a contradiction of the "one people, diverse and united" story National Day tells. It was something more useful: a reminder that knowing someone's community from the outside — Chinese, Malay, Indian, or Other — tells us far less than it feels like it should. Underneath the four familiar categories sits a second, and sometimes third, layer of real variation — by age, by sub-community, by faith, and by how faith quietly tracks with something as everyday as the size of the flat someone calls home. This article walks through what that data shows, in the spirit of the day: not just celebrating that we're diverse, but actually getting to know what that diversity looks like up close.
The Question Worth Asking
The question we tend to ask ourselves around National Day is some version of "how diverse are we?" — and the answer has been roughly the same for years: about three-quarters Chinese, the rest split mainly between Malay and Indian communities, with a small "Other" category. It's a true answer, and also an increasingly incomplete one, because it treats each of those four groups as internally uniform.
A more useful question — especially if the point of National Day is to actually understand the people standing beside us, not just share a public holiday with them — is this: how much variation exists inside each of those categories, and does knowing someone's category actually tell us much about how they live? As we'll see, the answer is often "less than we think." A 24-year-old Chinese Singaporean, an 80-year-old Chinese Singaporean, a Hokkien-speaking household, and a Cantonese-speaking household are all filed under the same word on a form — and are living through fairly different versions of Singapore.
All figures cited below, which are drawn directly from SingStat's General Household Survey 2025 tables (Source: Singapore Department of Statistics, General Household Survey 2025, tablebuilder.singstat.gov.sg).
A Younger, More Malay (and Older, More Chinese) Singapore
Singapore's resident population — citizens and permanent residents combined — stood at just over 4.2 million in the 2025 survey, of whom 3.66 million are citizens. Among residents overall, the ethnic split is: Chinese 74.0%, Malay 13.5%, Indian 9.0%, and Others 3.5%.
That ratio, though, is not constant across age groups. It shifts meaningfully at both ends of the age spectrum:
Age group | Chinese | Malay | Indian | Others |
Babies under 1 year | 65.3% | 23.7% | 8.1% | 2.8% |
Ages 0–4 | 64.7% | 23.3% | 8.4% | 3.6% |
Ages 25–34 | ~72.7% | ~16.1% | ~8.3% | ~3.0% |
Ages 70–74 | 82.3% | 10.2% | 6.2% | 1.4% |
Ages 90 and over | 86.8% | 5.9% | 5.9% | 1.4% |
All ages (national) | 74.0% | 13.5% | 9.0% | 3.5% |
Two patterns stand out. First, among the very youngest residents — babies under one year old — the Chinese share is nearly nine percentage points below the national average, while the Malay share is more than ten points above it. Indian and Other shares among babies are broadly close to the national figure. Second, the pattern reverses at the other end of life: past age 70, the Chinese share rises well above the national average while Malay and Indian shares fall.

It's worth being precise about what this data can and can't tell us. The survey doesn't ask why the age profile looks this way, so any explanation is an inference, not a finding. One plausible reading is a combination of two demographic mechanics that are well documented in Singapore's population statistics more broadly: comparatively lower birth rates within the Chinese community relative to the Malay community in recent years, and longer average life expectancy historically associated with the Chinese community, which would show up as exactly this kind of "younger and older ends look different from the middle" pattern. Both are population-level averages, not statements about any individual or family. Notably, the total fertility rate for ethnic Chinese (0.7) is about half that of the Malays (1.53) in 2025; which does explain some of what we see in the data.
One Race, Many Communities
The CMIO categories were built for administrative simplicity, not to describe internal uniformity — and the survey's detailed sub-group tables make that clear immediately.
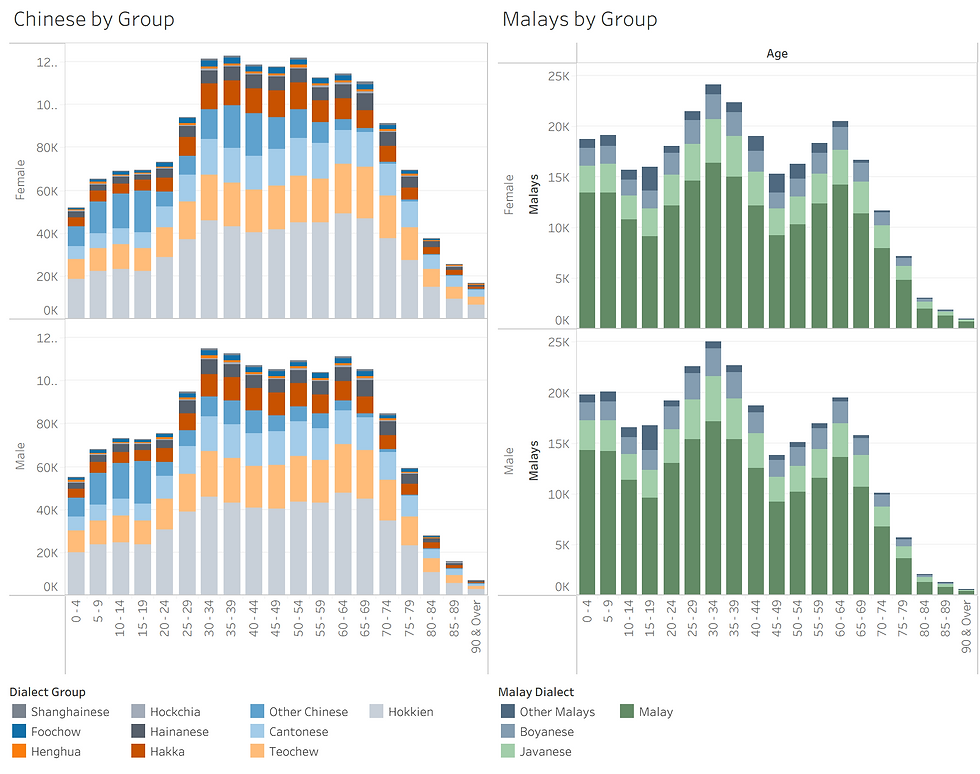
Within the Chinese community, the largest single dialect group is Hokkien, at 38.4% — the largest group, though short of an outright majority. Teochew (18.8%) and Cantonese (14.0%) are the next largest, and together with Hokkien the three account for about 71% of the Chinese resident population. The remainder splits across Hakka (8.7%), Hainanese (5.9%), and a longer tail of smaller communities (Foochow, Henghua, Shanghainese, Hockchia, and others), plus a residual "Other Chinese" group (10.0%).
Within the Malay community, the pattern is different: Malay proper forms a genuine majority at 67.3%, with Javanese (17.1%) and Boyanese (10.8%) — together around 28% — as the next largest groups, and a small remainder of other Malay communities.

Within the Indian community, Tamils are the largest group at 55.0%, but "Other Indians" — a broad category covering many distinct communities not separately tracked — make up 28.6%, followed by Malayalee (7.3%), Hindi (5.8%), and Sikh (3.3%).
Within the "Others" category — the group that, by definition, falls outside the CMIO framework entirely — the internal diversity is the most pronounced of all, and it changes with age. Overall, Filipino (22.9%) and Caucasian (21.8%) are the two largest groups, followed by a residual "Others" bucket (21.2%), Eurasian (13.3%), Burmese (8.6%), Arab (6.3%), and Thai (5.9%). Among residents under 14, the mix shifts noticeably: Caucasian (31.5%) and Eurasian (23.7%) — historically the community the "Other" category was originally created to describe when CMIO was first formalised — together account for over half of the "Others" population in that age band, well above their share of the adult "Others" population.
These are direct tabulations from the survey, not inferences. One caution worth naming: "Other Indians," "Other Chinese," and the residual "Others" bucket within the Others category are themselves aggregates of multiple distinct communities that SingStat doesn't break out further in this table. The real diversity inside each of the four CMIO groups is very likely greater than even these sub-group figures suggest.
Faith Follows Similar Lines — Mostly
Turning to religion, the national picture (among residents aged 15 and over — the survey does not collect religion data for younger children) is: Buddhism 30.9%, no religion 23.9%, Islam 15.0%, Christianity split between Catholic (7.6%) and other Christian denominations (9.5%, for a combined 17.1%), Taoism 7.3%, Hinduism 5.4%, and Sikhism 0.3%.

Religion tracks closely with ethnicity, as one would expect given Singapore's history: 98.6% of Malay residents identify as Muslim. Among Indian residents, Hinduism (58.8%) and Islam (22.5%) together account for roughly 81%. Among Chinese residents, Buddhism (40.1%) is the largest single affiliation, but "no religion" is also substantial at 30.3% — larger than any single Christian denomination or Taoism within the group. Among the "Others" category, the top three affiliations are Catholic (31.8%), no religion (23.6%), and Buddhism (21.8%) — a mix that plausibly reflects the nationalities within that group, though we'd class that specific link as an inference rather than something the table states directly.
The religion mix also shifts by age, and not uniformly. Comparing residents aged 15–29 to those aged 70 and over: Buddhism rises from 25.6% to 37.3% of the age band, no religion falls from 26.5% to 19.2%, Islam falls from 19.8% to 10.6%, and — the clearest generational shift in the data — Taoism falls from 5.1% to 11.8%, roughly a halving among the young relative to the old. The relative ranking of the top three faiths (Buddhism, no religion, Islam) holds across age bands, but the size of each slice moves more than "broadly consistent" would suggest, particularly for Taoism and Islam.
One claim we tested and could not confirm: that permanent residents' religious profile closely mirrors that of citizens. It doesn't, in two notable respects. Islam accounts for 16.5% of citizens aged 15+ but only 5.4% of permanent residents; Hinduism runs the other way, at 4.0% of citizens versus 13.6% of permanent residents. Buddhism and "no religion" are indeed similar across both groups (around 31% and 24–26% respectively), but the Islam and Hinduism gap is large enough that "mirrors closely" isn't the right description overall. One likely explanation is that Singapore's Malay community — overwhelmingly Muslim — is almost entirely citizens rather than permanent residents, while a meaningful share of Indian-origin permanent residents are more likely to be Hindu.
Where People Live, and their HIghest Education Attainment
The survey also cross-tabulates religion against housing type and highest qualification attained — two commonly used (if imperfect) proxies for socioeconomic circumstances. Two patterns are worth highlighting.
Residents who identify as Muslim are more likely to live in smaller HDB flats (1- to 3-room) than residents of other faiths — 29.3%, compared with roughly 15–20% for most other groups — and are the least likely to live in private housing (4.9%, versus 16–37% elsewhere). Muslim residents also report the lowest share with a university qualification (14.7%), alongside the highest share with below-secondary education (23.0%).

Residents who identify as Taoist show a similar pattern on education — the lowest university share after Islam, at 25.7%, and the highest below-secondary share of any group, at 33.8% — but a much weaker pattern on housing, where their small-flat share (19.4%) is close to the Buddhist figure (19.7%) rather than notably higher. In other words, the education gap for Taoist residents is clear in this data; the housing gap is not — worth naming, since it's easy to assume the two proxies move together.
At the other end, residents in the "Others" religion category (a small group, Catholic, Buddhist, and no-religion aside, covering roughly 3,400 people aged 15+) report the highest university share (59.4%) and the highest private-housing share (44.1%) of any religion group. Catholic, other Christian, Hindu, Sikh, and no-religion residents all cluster in a similar band — university shares of roughly 45–56%, and a meaningfully lower share in small flats (11–17%) than Muslim or Taoist residents — broadly matching a "better educated, leaning toward larger or private housing" description, though the effect is more consistent on education than on housing type specifically.
We want to be direct about what this section does not show: a correlation between religious affiliation, housing type, and education is not evidence that religion causes either outcome. These patterns almost certainly reflect a mix of historical settlement patterns, generational and migration history, age structure (older residents skew toward certain faiths and housing types simply because of when they were housed), and other unmeasured factors. Presenting this as "faith X causes lower income" would be a real overstatement of what a cross-tabulation can show; the honest description is that these groups' current circumstances differ, and religion is one of several variables that correlates with that difference.

On marital status, the data is more reassuringly uniform than not: married and single shares are broadly consistent across religions, typically 56–65% married and 25–33% single. The one clear exception is the small "Other Religions" group, at 82.4% married and 11.8% single — a genuine outlier, though on a base small enough (roughly 3,400 people) that we'd treat it as a data point to watch rather than a firm conclusion.
The Language Part of the Pledge
Race and religion get most of the attention in a conversation like this one, but the Pledge names a third thing too: language. Singapore settled on English as its working language early on — the language of government, business, and, for every child regardless of race, roughly half the school timetable, with the other half spent on a compulsory "mother tongue" of Mandarin, Malay, or Tamil. Given how thoroughly that policy has shaped daily life, and Singapore's habit of quietly overdelivering on policy intent, it's reasonable to expect English to have become the main language spoken at home too, not just at work and in the classroom.

The General Household Survey 2025 confirms this, and then some. English is now the single most common main language spoken at home, reported by 58.1% of residents aged 5 and over — more than Mandarin (26.6%), Malay (7.0%), Chinese dialects (4.9%), and every Indian and other language combined (3.4%). Mandarin's 26.6% is worth sitting with for a moment: on its own, it's a larger share of the population than Singapore's entire Malay and Indian communities combined, and almost certainly reflects Chinese-ethnicity households choosing Mandarin over English or a dialect as their main home language — a reasonable inference, though this particular table doesn't cross-tabulate language against race directly, so we're not stating it as a fact the data proves outright. A further 4.9% of residents' main home language is a Chinese dialect rather than Mandarin or English — a small, direct echo of the dialect diversity we found earlier within the Chinese community itself.
But the more interesting number here isn't which single language people put first — it's how many report only one. Just over a quarter of residents aged 5 and over (25.3%) speak only one language regularly at home. The remaining three in four (74.7%) routinely speak two. Even within the "English main language" group, only 19.5% speak English exclusively; the rest also speak a second language at home, most often Mandarin — English-and-Mandarin is, in fact, the single largest language combination in Singapore, ahead of every "one language only" category, English included. Given everything else this article has walked through — CMIO categories that turn out to hold multiple communities apiece, four major faiths and several minor ones, more than a dozen sub-ethnic identities — it would honestly be more surprising if most households spoke only one language at home. Bilingual education's quieter achievement may not be getting everyone onto English so much as making it unremarkable for a home to run on two languages at once.
What This Data Doesn't Tell Us
A few limitations are worth stating plainly. The General Household Survey is a large sample survey, not a full census — figures are estimates, and SingStat's own notes flag that totals may not sum exactly due to rounding. Religion data is only collected for residents aged 15 and over, so none of the religion findings above extend to children. The CMIO framework itself is an administrative classification designed decades ago for policy purposes; it was never intended to capture how people self-identify culturally, and the "Others" and "Other Indians"/"Other Chinese" residual categories in particular blend genuinely distinct communities into one number. And every cross-tabulation in this article describes association, not cause — a point worth repeating given how easy it is to read "more likely to live in a smaller flat" as an explanation rather than an observation.
The Broader Lesson: A Label Is Not a Life
None of this is really a story about statistics — it's a story about what a label quietly does to our imagination. "Chinese," "Malay," "Indian," "Muslim," "Buddhist," "Taoist": each one is accurate, and each one does far less work than we assume when we use it to picture what someone's actual life looks like.
That matters most in the small, everyday moments National Day is really about — the neighbour we nod to in the lift, the colleague whose Hari Raya, Deepavali, or Vesak Day we half-understand, the hawker uncle whose dialect we've never once asked about. It's easy to feel like we already know someone once we know their race or religion. The data says the opposite: knowing the category is usually just the start of a longer, more interesting conversation — not the end of one.
That's arguably the more demanding version of "regardless of race, language or religion." Not simply looking past our differences, but staying curious about what's actually inside them.
In Closing
Singapore's population data backs up the story we tell ourselves every National Day — that this is a genuinely multicultural place — and adds real texture most of us never get to see. The four familiar categories each contain meaningful internal variation by age, sub-community, and faith, and knowing someone's category tells us less than it feels like it should about how they actually live. What the data doesn't support is treating any of the correlations we found as settled explanations, or assuming the labels we're used to are as internally uniform as their single headline percentage suggests.
We've built an interactive dashboard so you can explore these numbers yourself, cut by age, race, religion, dwelling, and marital status — a small way to get to know the Singapore around you a little better this National Day, rather than take our summary of it on faith:
Explore the dashboard: Singapore Population Survey 2025 — Race, Language and Religion
This National Day, what's one assumption about a neighbour, colleague, or fellow Singaporean — based on a label you already knew — that might be worth setting aside for an actual conversation?
If you enjoy practical analytics content like this, consider subscribing for more articles on data analytics, AI, visualisation, decision science, and data storytelling.


Comments