
The career story we were sold — and the probabilistic reality we live in
- Mar 1
- 5 min read

Many of us grew up with a fairly tidy storyline:
Study hard → get a credential → land a stable job → work your way up → buy the things adults buy → and you’ll be “set”.
Sir Ken Robinson often challenged the idea that education (and by extension life) is neat and linear — that you move from one stage to the next and arrive at a guaranteed outcome.
And here’s the thing: that storyline does work out for many people.
Just not for everyone.
That gap—between “this is how it works” and “this is what happened to me”—is where frustration, anxiety, and the modern “rat race” narrative tends to grow.
A helpful way to reframe it is this:
The storyline was never a guarantee. It was a probability.
Linear thinking in a probabilistic world
When we talk about careers and income, we often speak in certainty:
“If you do X, you’ll get Y.”
“If you study the right course, you’ll be safe.”
“If you work hard, you’ll be rewarded.”
But real outcomes don’t behave like a recipe. They behave more like a distribution.
Even if two people follow the same “instructions”:
they won’t get identical results,
they won’t face identical constraints,
and they won’t encounter the same opportunities at the same time.
This is where a basic idea from statistics becomes unexpectedly human:
If lots of people follow the same pathway, you tend to see a clustering around the middle (the “typical” outcome), and fewer people at the extremes (exceptional outcomes—good or bad). That’s not a moral judgement. It’s what probability tends to produce when many factors combine.

So when someone says, “I did what I was told, and I didn’t get what I was promised,” one interpretation the data invites us to consider is:
You may have followed the most common path—and gotten a common outcome. Or you may have followed it and still landed above or below the average because variance is part of the system.
That’s not “fair” or “unfair”. It’s simply a reminder that life is multicausal.
What the “average Singaporean” income arc looks like (and what it hides)
In Singapore, we have unusually good labour market data, which makes this discussion more concrete.
At a national level, the median gross monthly income (including employer CPF) for full-time employed residents was $5,500 in 2024 (mid-year).
When you break income down by age, a fairly recognisable arc tends to appear:
early-career incomes start lower and rise through the 20s and early 30s
mid-career incomes are typically strongest through the 40s and early 50s
incomes tend to soften approaching the later-career / retirement transition
This “arc” is a useful benchmark because it describes what tends to happen for the middle of the distribution—not what must happen to any individual.
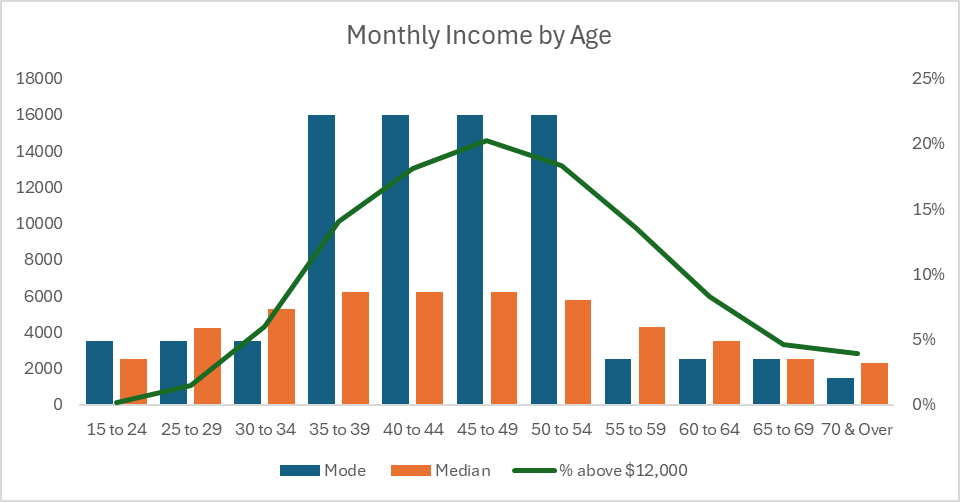
A common misread: “This is my future”
A chart like “Monthly Income by Age” can feel like a prediction.
But it’s not a prophecy. It’s a pattern in the population.
It tells you something like:
“If you pick a random full-time employed resident in this age band, typical incomes are in this range.”
It does not tell you:
what industry that person is in,
what occupation they hold,
whether they changed careers,
whether they took time out for caregiving,
whether they’re self-employed,
whether their pay includes variable bonuses that swing year to year,
or whether they had structural advantages or constraints along the way.
Even official sources remind readers that these income estimates come from surveys and should be interpreted with care, especially in year-to-year comparisons.
So the chart is valuable—but only if we treat it as context, not destiny.
“Do what everyone else is doing” usually leads to average results
This is one of the most practical (and emotionally difficult) truths about careers:
If you follow a well-trodden path that many people follow, your odds of landing near the middle increase.
That’s not pessimism—it’s a baseline.
It also explains two things that can feel contradictory:
Most people who follow the “standard path” do okay.
Some people who follow the same path don’t.
Both can be true because the standard path is not a guarantee—it’s a probability distribution with variance.
And once you accept that, the conversation changes from:
“Why didn’t the system deliver what it promised?”
to:
“What variables are actually shaping outcomes, and which ones can I influence?”
That’s a far more useful question.
Yes, you can change your odds — but not by pretending constraints don’t exist
People often jump to simple levers:
“Work harder.”
“Hustle more.”
“Up-skill.”
These can matter—within limits.
Because everyone is constrained by:
24 hours a day,
different starting points,
different responsibilities,
different appetites for risk,
and different definitions of a “good life”.
So the more grounded approach is:
Improve your odds by being deliberate about where effort goes
Effort isn’t just “more hours”. It’s better targeting:
Which skills compound in your field?
Which roles create leverage (leading teams, owning outcomes, managing budgets)?
Which industries pay for scarcity (specialised expertise, regulated knowledge, high-value client work)?
Which moves improve future optionality?
This is where data can help—not as a promise, but as a decision aid.
And it’s why looking at income by industry, occupation, and education can be more informative than looking at age alone. The age curve is the headline; the real story is in the segmentation.
The missing question isn’t “how do I earn more?” It’s “why am I earning more?”
This is the part we don’t talk about enough.
If your life success is reduced to a single number—paycheck, net worth, job title—then you’re likely to end up running someone else’s race.
And that race has no finish line, only moving goalposts.
An alternative way to look at “success” is as a multivariate outcome:
income (yes),
but also health,
family,
time,
meaning,
peace of mind,
autonomy,
contribution.
Money is often a means to those ends—but it is rarely the entire end.
The practical implication is not “don’t care about money”. It’s:
Be honest about what money is for in your life.Because if you don’t define your own “why”, you’ll default to the loudest one around you.
So what should you do with all this?
Here are the key takeaways, framed as decision-support rather than advice:
If you do what everyone else is doing, you’re more likely to get an average outcome. Any variation (above or below) is partly driven by chance and partly by hidden variables.
Feeling disappointed by the gap between expectation and reality is understandable. But the lever that helps most is shifting from grievance to strategy: What can I learn about the distribution I’m in?
You can improve your odds by being targeted. Especially by understanding how income varies by sector, occupation, and education—not just age.
The most important work is defining your “why”. Because without it, “earning more” can become an endless treadmill rather than a designed choice.
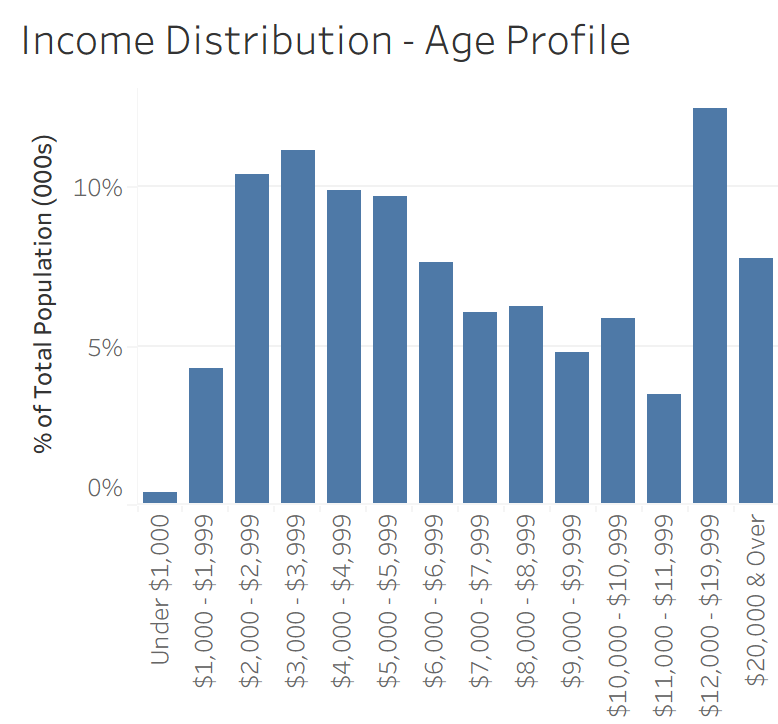
If you want to take a data-driven look at your own income circumstances
If you’re keen to benchmark Singapore’s income landscape—by age, industry, occupation, and education, household— Click the visual for you to validate the above and see where you strand.

Reach out if you have any questions on the topic....or the charts


Comments