
The Dashboard Looks Good. But Is It Answering the Right Question?
Why good analysis starts before we open the data
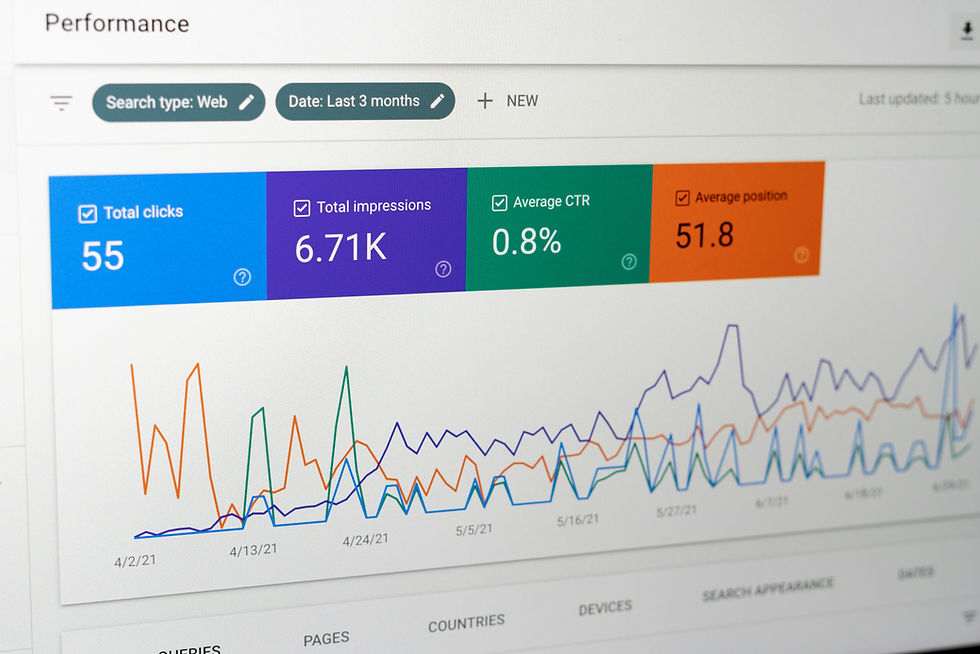
Imagine walking into a monthly management meeting and seeing a new sales dashboard on the screen. It looks impressive: revenue by month, sales by region, top-performing products, customer segments and year-on-year growth. There are filters to explore the numbers, several well-designed charts and perhaps even an AI-generated summary highlighting some of the more interesting movements.
Then someone asks a simple question: “Why are our sales falling?”
The dashboard tells us that sales are down 8%. It shows us when the decline started, which regions have been affected and which products have performed poorly. We may even be able to see that some customer segments have declined more than others.
All of that is useful. But none of it necessarily tells us why sales are falling.
There may be nothing wrong with the dashboard. In fact, it may be doing exactly what it was designed to do: monitor sales performance and alert management when something changes. The problem comes when we expect a dashboard designed to tell us what happened to also tell us why it happened and, eventually, what we should do about it.
That raises a much more fundamental issue than dashboard design. What question are we actually trying to answer?
A business problem is only the beginning
“Sales are falling” sounds like a reasonable place to start an analysis, but it isn't really a question yet. It is a business problem, and there may be several different things management wants to understand about it.
Perhaps they want to know whether the decline is temporary or part of a longer trend. Perhaps they want to know which products, regions or customers are responsible. Perhaps they are trying to understand what is causing the decline. Or perhaps they already know enough about the problem and are deciding what to do next.
Those are very different questions, even though they all begin with the same business problem.
Suppose we have several years of sales transactions containing dates, customers, products, regions, quantities and prices. If we ask “What happened?”, the data may tell us that revenue fell 8% last quarter. If we ask “Where did it happen?”, we might discover that most of the decline came from two regions. If we ask “Who was affected?”, we may find that sales to repeat customers fell substantially while new-customer sales remained relatively stable.
Each question takes us a little deeper, but we are still describing what happened. The moment we ask “Why did it happen?”, things become more difficult.
Our sales transactions may tell us what customers bought, when they bought it and how much they spent. They may not tell us why their behaviour changed. To investigate that, we might need information about price changes, promotions, stock availability, competitor activity, customer satisfaction or something else that isn't in our original dataset.
This is an important analytical judgement. When we have a lot of data available, it is easy to assume that somewhere inside it lies the answer to whatever question we choose to ask. That simply isn't always true.
Sometimes the data we have cannot answer the question we want to ask.
Adding more charts won't solve that. Neither will applying a more sophisticated statistical technique. We first have to recognise the gap between the question we are asking and the evidence available to answer it.

From a broad question to something we can investigate
Even “Why are sales falling?” may still be too broad to analyse directly.
Falling compared with when? Is the decline across the whole business or concentrated in particular products? Are we losing customers, or are existing customers simply buying less? Are customers purchasing less frequently? Has the average transaction value fallen? Did prices change? Were important products unavailable?
Breaking a broad business question into smaller analytical questions isn't making the problem unnecessarily complicated. It is giving the analysis direction.
Suppose our first analysis reveals that most of the decline is coming from repeat customers. That is already more useful than simply knowing that total sales fell 8%, because we now know where to investigate next. But we still don't know why those customers are buying less.
Perhaps prices increased. Perhaps important products have been unavailable. Perhaps competitors are offering better alternatives. Perhaps customers are becoming dissatisfied with the service. Or perhaps their needs have simply changed.
These are all plausible explanations, but at this stage they are hypotheses, not findings.
That distinction is easy to overlook. If we see repeat-customer sales declining and immediately conclude that customer satisfaction has deteriorated, we have jumped from an observation to an explanation without enough evidence. We may then recommend a loyalty programme, improve customer service or offer discounts when the real problem is that a popular product has been out of stock for three months.
A hypothesis gives us something to investigate. It doesn't give us permission to treat an explanation as fact.
Once we think this way, the analysis becomes much more focused. If we suspect price is a factor, we can examine what happened before and after price changes and whether particular customers or products responded differently. If we suspect availability, we can investigate which products experienced stock-outs and what their customers did next. If we suspect dissatisfaction, we can look for supporting evidence in customer feedback, complaints, retention or other measures.
Instead of opening a dataset and searching for anything interesting, we begin looking for evidence that helps us support, weaken or eliminate possible explanations.
The technique then follows naturally from the question. Trends and comparisons may be enough when we want to understand what happened. Segmentation helps us investigate where it happened and among whom. If we are exploring possible drivers, relationships between variables may become useful and techniques such as correlation or regression may have a role.
But the technique itself is never the objective. It is simply a tool for helping us answer the question.

This is also why I am uncomfortable when an analytics project begins with “Which technique should we use?”, “Which chart should we build?” or even “What dashboard should we create?”
I would rather start with “What are we trying to understand?” The technique comes later.
From understanding the problem to making a decision
There is an even more useful question we can ask when the situation allows it:
“What decision are we trying to make?”
Suppose sales have fallen and management is considering whether to offer a discount. Knowing the decision immediately gives the analysis more direction. We would want to understand whether price is likely to be contributing to the decline, which customers appear most price-sensitive, what happened during previous promotions, how much additional volume would be required to compensate for the lower margin and what other options management might have.
Now imagine management is instead considering whether to discontinue an underperforming product. We are still dealing with falling sales, but the questions change. We may now care about profitability, which customers depend on the product, whether they are likely to switch to another product we sell, and what removing it might do to the wider customer relationship.
Same business problem. Different decision. Different questions. Different analysis.
Working backwards from the decision can therefore be extremely powerful:
What decision needs to be made? What would we need to know to make it? What evidence would help us answer those questions? What analysis could provide that evidence? And what data would the analysis require?
That direction is quite different from beginning with whatever data happens to be available and asking what interesting things we can find.

Of course, I wouldn't turn “decision first” into another rigid analytics rule. Business problems aren't always tidy enough for that.
Sometimes management genuinely doesn't understand the problem well enough to know what decision needs to be made. In those situations, exploratory analysis is entirely appropriate. We may look for patterns, unusual movements, differences between groups or changes over time. What we discover can help us understand the problem and frame better questions.
The important thing is to recognise the difference. Exploration is useful when we are trying to discover what might matter. Decision-focused analysis is useful when we know what decision or problem the analysis needs to support.
Both have a place. What we want to avoid is exploring a dataset, finding something interesting and then retrospectively treating that finding as though it were the question we intended to answer all along.
There is also a point where analysis has to meet the realities of business decision-making. We rarely have perfect information, and we can almost always collect another dataset, ask another question or run another analysis. At some stage, management has to decide whether the evidence is sufficient to act.
Imagine our investigation suggests that repeat customers became less active shortly after a price increase. Customer feedback also shows growing concern about value for money, while a small group that received a targeted promotion subsequently increased its purchases.
Do we now know with absolute certainty that price caused the decline? Probably not. But we may have enough evidence to justify a limited pricing experiment rather than waiting for perfect proof. The result of that experiment then becomes new evidence.
Good analytical thinking therefore isn't simply about finding the “correct answer.” It is also about understanding the strength of the evidence, being clear about what remains uncertain and deciding whether further analysis is likely to change the decision.
Sometimes the right recommendation is “We have enough evidence to act.” At other times, it may be “We need more information before making this decision.” And occasionally, the most sensible next step isn't another analysis at all, but a small experiment that allows us to learn.
AI can give us answers. It still needs a good question.
Generative AI has made analysis remarkably easy to start. We can upload a spreadsheet and ask AI to summarise it, calculate statistics, identify patterns, suggest charts and highlight unusual observations. What once took hours can sometimes be produced in minutes.
That is a tremendous advantage. It also introduces an interesting risk. We can now produce the wrong analysis much faster.
Ask AI to “analyse this sales dataset and identify insights”, and it will almost certainly find something. It might identify declining products, regional differences, unusual customers or changes in buying behaviour. Some of those observations may be genuinely useful.
But AI doesn't automatically know which business decision matters most, what management is worried about, which explanations are plausible in your organisation or what actions are realistically available. More importantly, it cannot create evidence that isn't in the data. If customer dissatisfaction isn't measured anywhere, analysing sales transactions more intensively won't suddenly tell us whether customers are unhappy.
This is why I think the better our tools become at producing answers, the more important it becomes for us to frame the question properly.
The calculations are becoming easier. Creating charts is becoming easier. Even finding patterns in large datasets is becoming easier. The harder part remains deciding which problem deserves attention, which question needs answering, what evidence would be convincing and what we are prepared to do with the answer.
AI doesn't make analytical thinking less important. In many ways, it makes it more important.
So the next time someone asks for a dashboard, perhaps don't begin by opening Power BI, Tableau or Excel. Spend a little time understanding the problem first. What has happened? What does management actually want to understand? What are we assuming? What explanations are worth investigating? Is there a decision that needs to be made? And what evidence would help us make that decision with reasonable confidence?
Once those questions become clearer, the analysis often becomes easier to design because we know what it needs to accomplish. Sometimes the answer will indeed be a dashboard. Sometimes it will be a focused analysis, a simple chart, additional data collection, a customer survey or a small experiment.
And that's perfectly fine, because the purpose of analytics isn't to produce more analysis. It is to help us understand a business problem well enough to make a better decision.
A good dashboard can give us answers. Good analytical thinking makes sure we're answering the right question.
Quick Reference
Business problem
A situation that requires attention, such as falling sales, increasing customer complaints or high employee turnover. It tells us what is concerning the organisation, but it may still be too broad to analyse directly.
Hypothesis
A possible explanation that can be investigated using evidence. A hypothesis gives the analysis direction; it is something to test, not something already established as fact.
Descriptive analysis
Analysis used to understand what has happened, often through trends, comparisons, summaries and changes over time.
Diagnostic analysis
Analysis that investigates why something may have happened by examining possible drivers, relationships and competing explanations.
Exploratory analysis
Examining data to discover patterns, unusual observations or questions worth investigating when we do not yet know precisely what we are looking for.
KPI
A Key Performance Indicator used to monitor an important aspect of business performance. A KPI can alert us that something has changed without necessarily explaining why.
Dashboard
A visual collection of measures and charts used to monitor and communicate information. A dashboard can support analysis, but it does not automatically explain why something happened or what should be done about it.
Finding
Something we observe in the data. “Sales fell 8% last quarter” is a finding. A finding becomes more useful when we interpret what it means in the context of the business problem.
Insight
An interpretation of evidence that improves our understanding of the problem and potentially changes what we investigate or do next. Discovering that most of the sales decline came from previously high-value repeat customers, for example, gives management a much more focused area to investigate.
Decision-focused analysis
Analysis designed around a decision that needs to be made. It works backwards from the decision to determine the questions that need answering, the evidence required and ultimately the data needed.


Comments